Data & Analytics Platform · 2026
World Cup Analytics
Nearly a century of World Cup history, explored.
An interactive data application for exploring tournaments, teams, matches, and historical trends across the history of the FIFA World Cup.
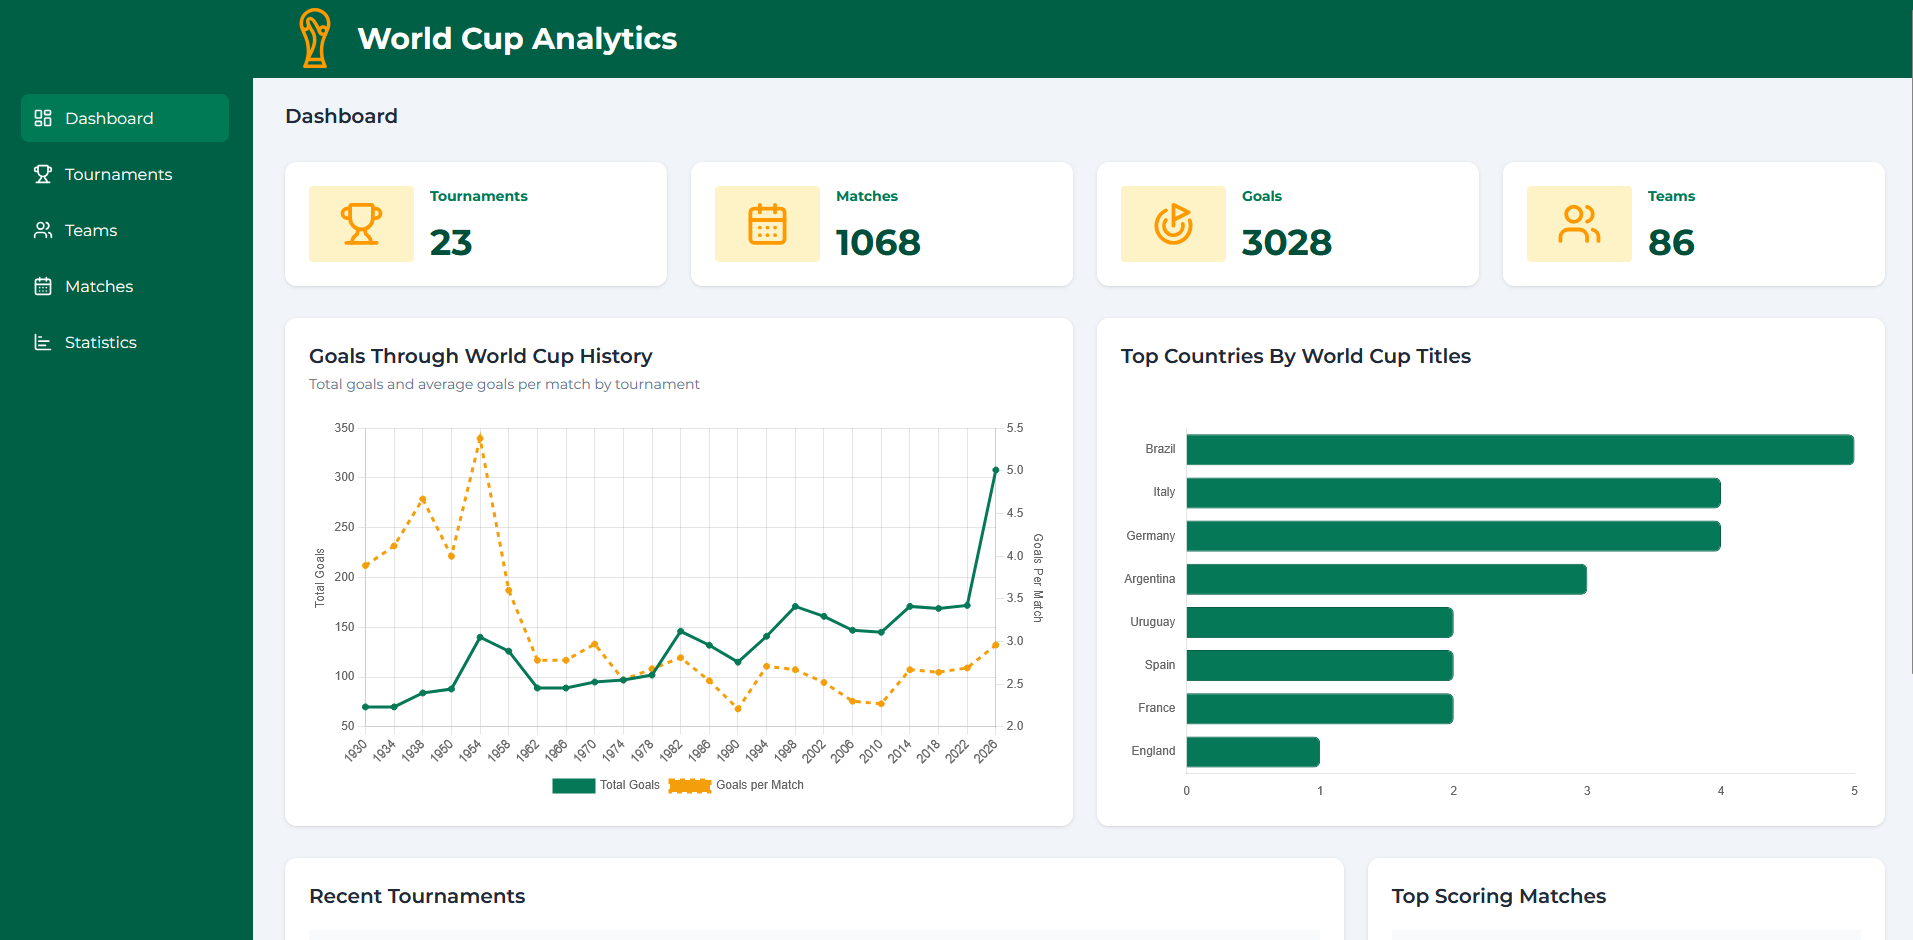
The ProjectTurning World Cup history into something explorable.
World Cup Analytics began with historical match and tournament data and a simple idea: turn that data into an application that makes nearly a century of World Cup history easier to explore.
Building it meant more than creating charts. The raw data had to be organized into a relational model, historical inconsistencies had to be accounted for, and the backend needed to support filtering and aggregation across more than a thousand matches.
The finished application combines a FastAPI backend and PostgreSQL database with a Vue interface for exploring tournaments, teams, individual matches, and broader trends throughout World Cup history.
Digging inMaking sense of the data.
The source data looked simple at first—teams, tournaments, matches—but historical soccer data gets messy quickly. Country names change, teams disappear, records are inherited, and the same team can appear under multiple names across different eras.
Germany was the clearest example. West Germany is generally treated as part of Germany’s historical record, so storing every team name as a separate entity would have made historical comparisons misleading. I handled that by separating canonical teams from the names used in individual match records.
Match records link to canonical team IDs rather than relying only on team-name strings. Aliases preserve the historical names that appeared in the source data while still allowing statistics to roll up to the correct modern team.
Tournaments, teams, and matches were normalized into separate tables so the API could filter, aggregate, and compare data without repeatedly parsing text values. That structure became the foundation for everything else in the application, from team histories to tournament summaries and match filtering.
Showcasing The DataFrom 1930 to 2026.
The fun part of digging through nearly a century of data is getting to display it in an interesting way. From bar charts to line graphs to pie charts to sorted tables, each view offers a different way to uncover the stories hidden in the numbers.
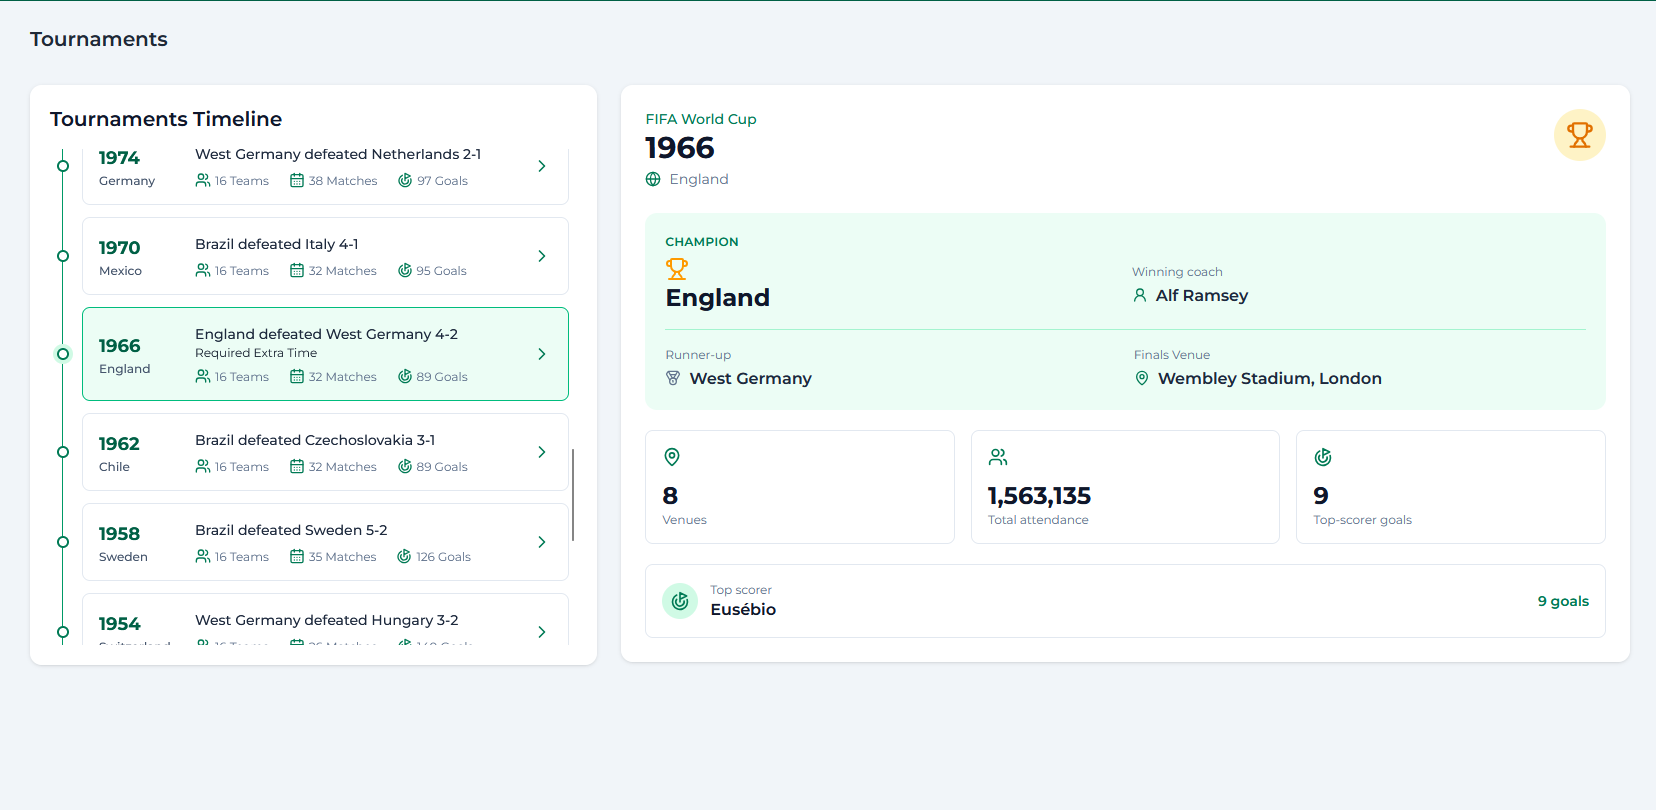
A timeline of every World Cup Tournament ever played, with the selected year's details displayed.
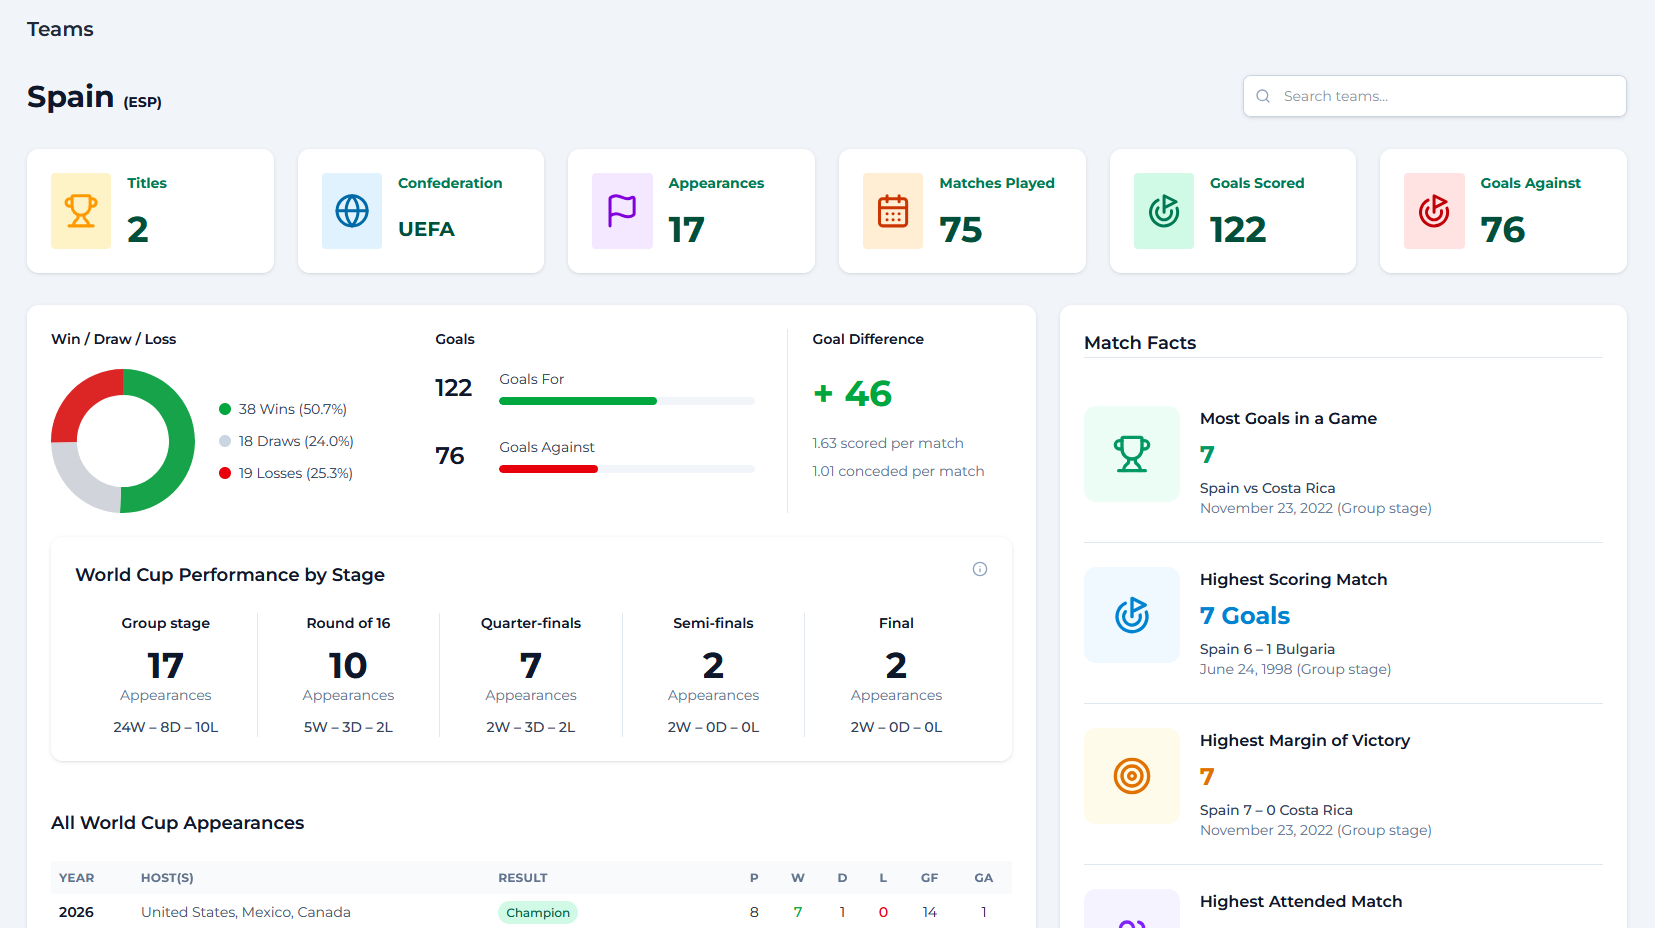
Search through every country that's ever participated and see various facts about them.
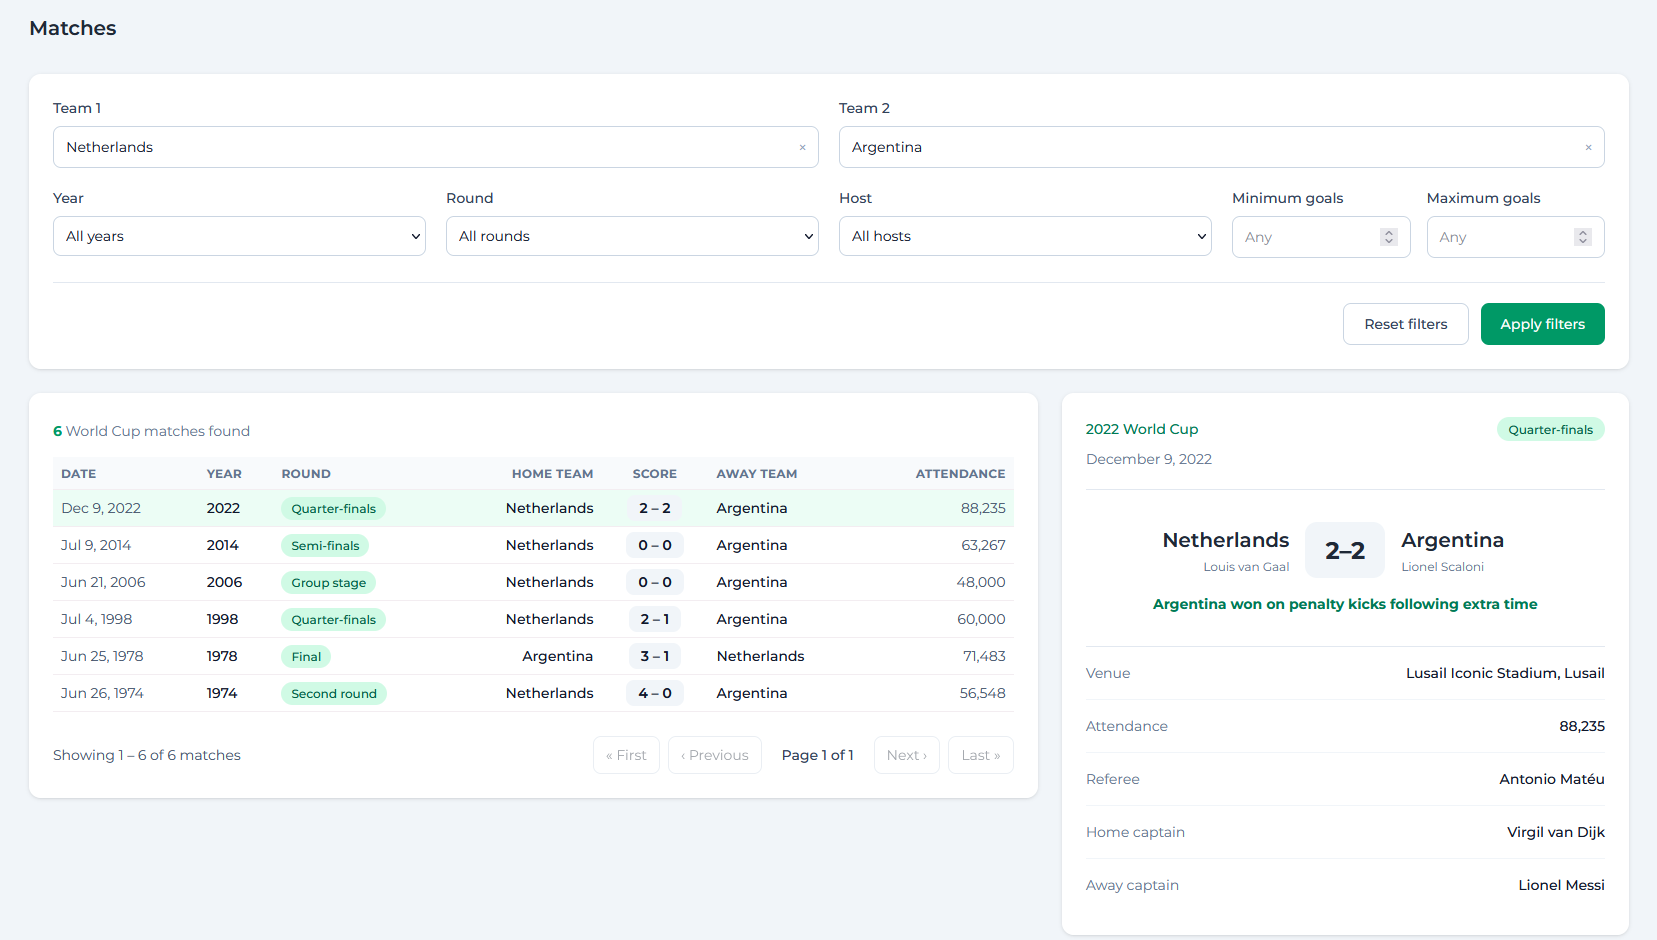
Every match ever played, filterable.
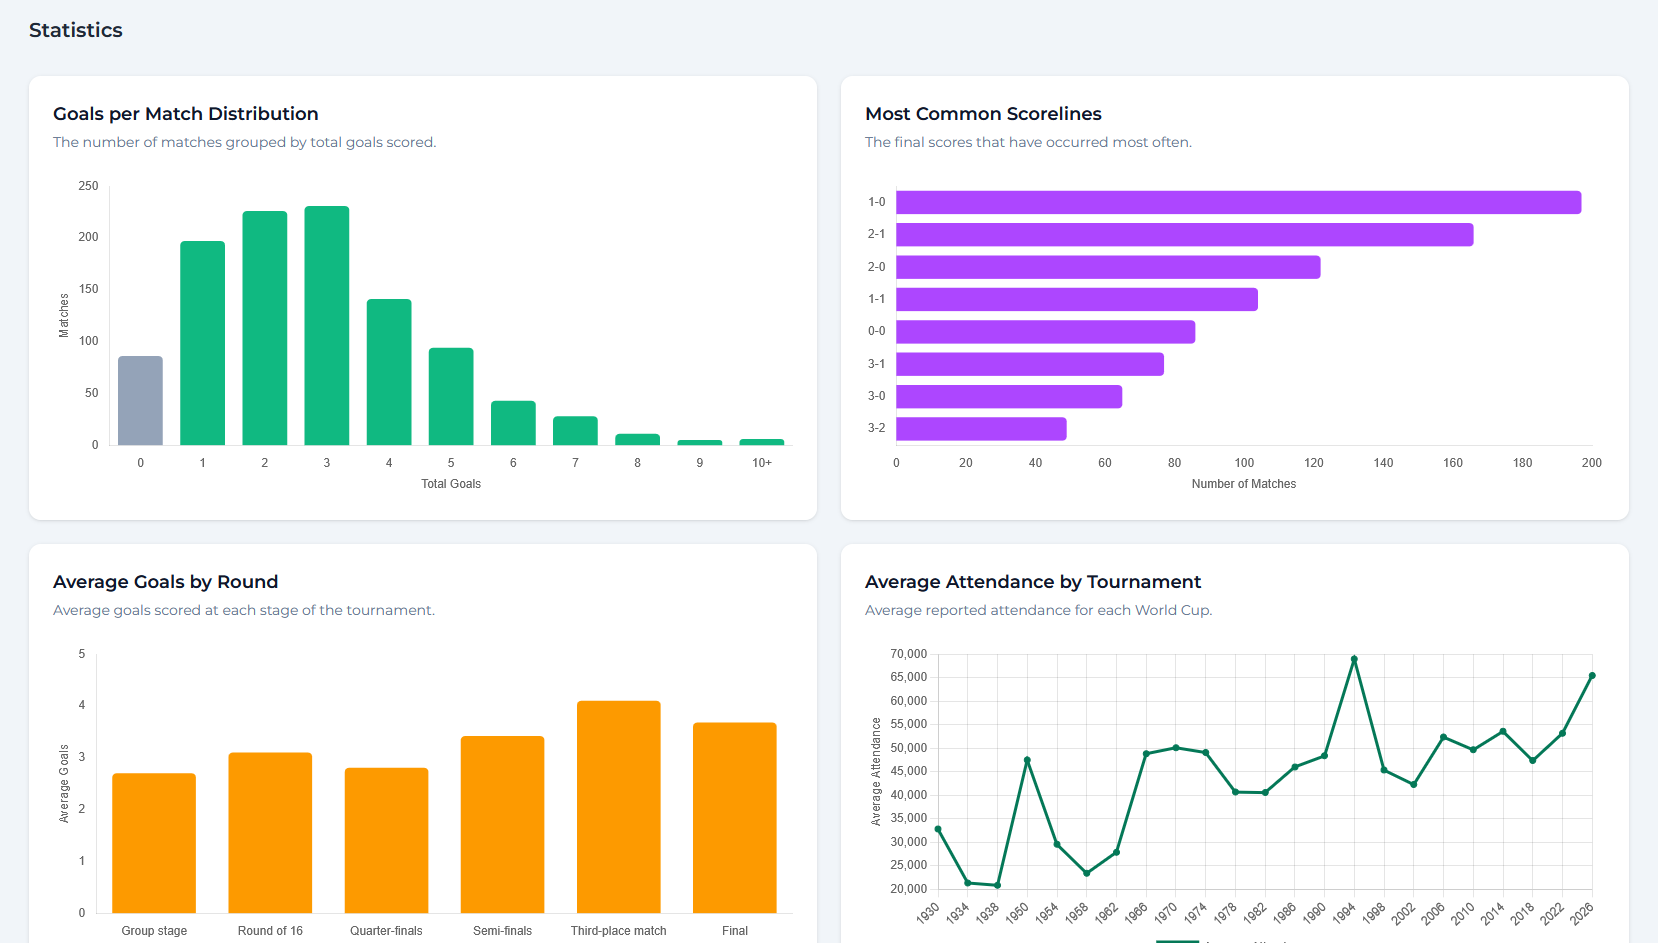
Various charts displaying interesting data like the most common scoreline.
Under The HoodBuilt with Laravel. Designed like a real application.
Python + FastAPI
A REST API built with FastAPI handles data retrieval, filtering, aggregation, and the connection between the database and front end.
PostGreSQL
Relational data model for tournaments, teams, aliases, and more than a thousand historical World Cup matches.
Vue 3
A component-based interface for navigating tournaments, exploring teams, filtering matches, and presenting statistics.
Server-Side Filtering
Match filtering and pagination happen through the API, keeping the interface responsive without loading the entire dataset into the browser.
Chart.js
Historical data is transformed into interactive charts for comparing teams, tournaments, goals, and trends over time.
Vite + Tailwind
Tailwind handles the interface design while Vite provides the front-end development and build tooling.
Building World Cup AnalyticsA familiar subject. A different stack.
I've spent most of my career as a PHP developer, so I used this project as an opportunity to step outside my usual stack and build something in Python. I had some experience with the language going in, but building a complete application with FastAPI gave me a much deeper understanding of Python and its ecosystem.
The World Cup has always been one of my favorite sporting events, so it was an easy subject to stay curious about. Working with nearly a century of matches gave me plenty of opportunities to ask questions of the data, figure out how to model it, and find interesting ways to present what I found.
Previous Project
← AgencyOS